Progress report (2021)
Background
Acoustic waves are currently widely used for the characterization of low density fish schools [1]. For this type of school, the waves encounter only one fish during their propagation (simple scattering regime). In this case, classical techniques using echograms are used to access the school biomass.
The objective of the project is to develop methods for acoustic estimation of biomass in the case of very dense schools (for the aquaculture industry in particular). In this case, the acoustic wave interacts with several fish during its propagation and the echograms are strongly impacted by these multiple scattering effects. Acoustic (non-invasive) fish counting is therefore one of the biggest challenges for the aquaculture industry today [2].
The idea is to exploit theories coming from multiple scattering at small scales (optical and electronic transport, matter waves...) and to apply them to the scale of aquaculture cages anchored in the open sea.
Case N°1: high density cages - small fish (Bream - Wolffish - Tenderloin) - mesoscopic physics
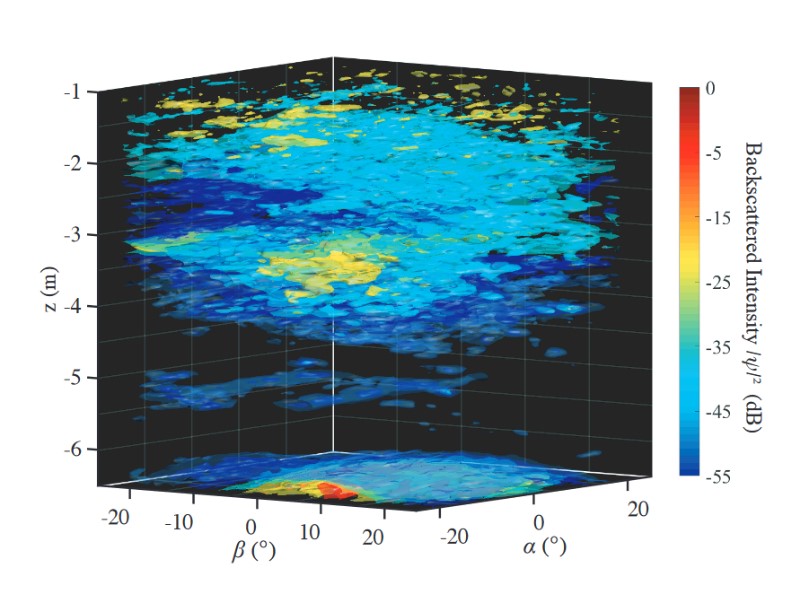
The first measurement campaign concerned cages containing a very high density of fish (∼20-50 fish/m3) of average size (Bream, Wolffish, Lean for an average weight ranging from 100 to 800 g). The results described in this paragraph were obtained during experiments at the Aquafrais farm in Cannes from 6 to 9 May 2019. The volume scan of these schools (Fig. 1) using the Seapix Mills Cross sounder reveals the multiple scattering of acoustic waves: the image obtained is not "sharp" but is a speckle pattern (spots of random intensity and position).
Figure 1: Acoustic scan of a cage containing a high density of bream revealing a speckle pattern.
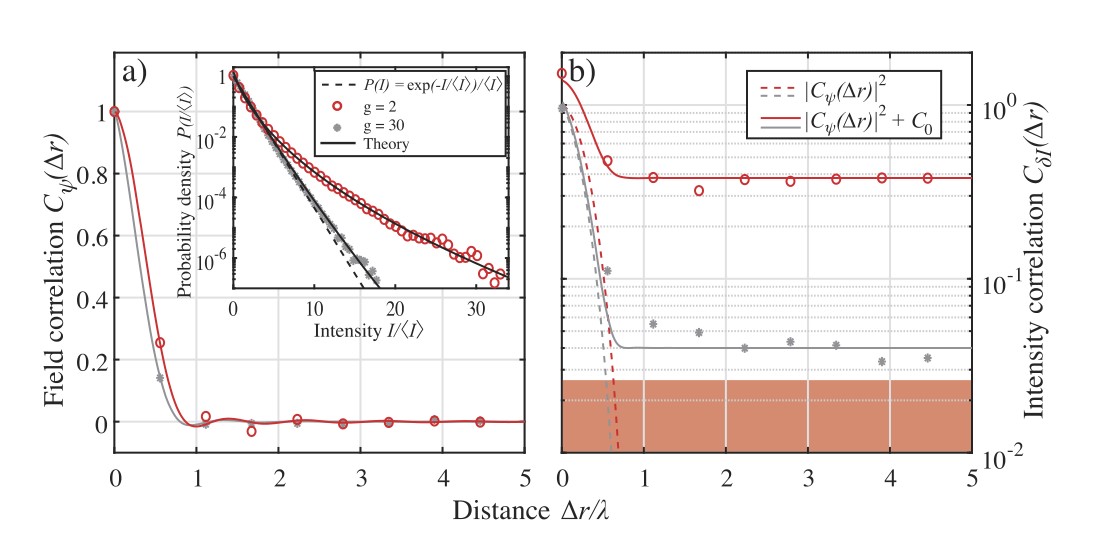
One way to analyze this image is to study its statistical properties. Thus, we measure the probability density or spatial correlations of the speckle (Fig. 2). Fitting these measurements with multiple scattering theories gives access to new "mesoscopic tools" that are very sensitive to the fish density of the school [3]. For example, the acoustic conductance of the fish school (Fig. 2) is a parameter derived from a direct analogy with electron transport and its measurement is highly dependent on biomass.
Figure 2: Spatial correlations of the acoustic field (a) and intensity (b) measured for a dense (red circles) and diluted (gray stars) school. While the acoustic field correlation seems to depend little on biomass, the speckle intensity correlation is highly impacted by fish density. Inset: probability density of the speckle pattern allowing to extract the conductance g of the shoal showing a strong dependence on the fish density.
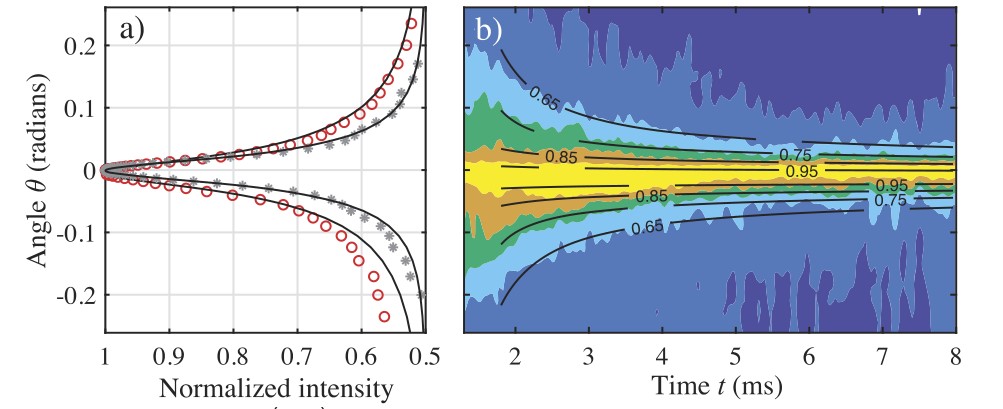
Another analogy with classical physics and in particular with optical waves has allowed the measurement of the coherent backscattering effect (CBS) [4]. Coherent backscattering (analogous to the phenomenon of luminous glory) is an interference effect between the emitted wave and the waves scattered by the fish school. This effect is manifested by an angular dependence of the acoustic intensity backscattered by the school of fish (Fig.3). Thus, the plot of acoustic intensity versus angle reveals a cone (of amplitude 2) whose width depends on the density of fish in the school. The Seapix is the only Mills Cross echosounder capable of scanning the acoustic field finely enough to observe this kind of phenomenon.
Figure 3: Angular dependence of the probed acoustic intensity for high (red circles) and low (gray stars) fish density. This measurement reveals the coherent backscatter cone whose width (inset a) and temporal evolution (inset b) depend on biomass.
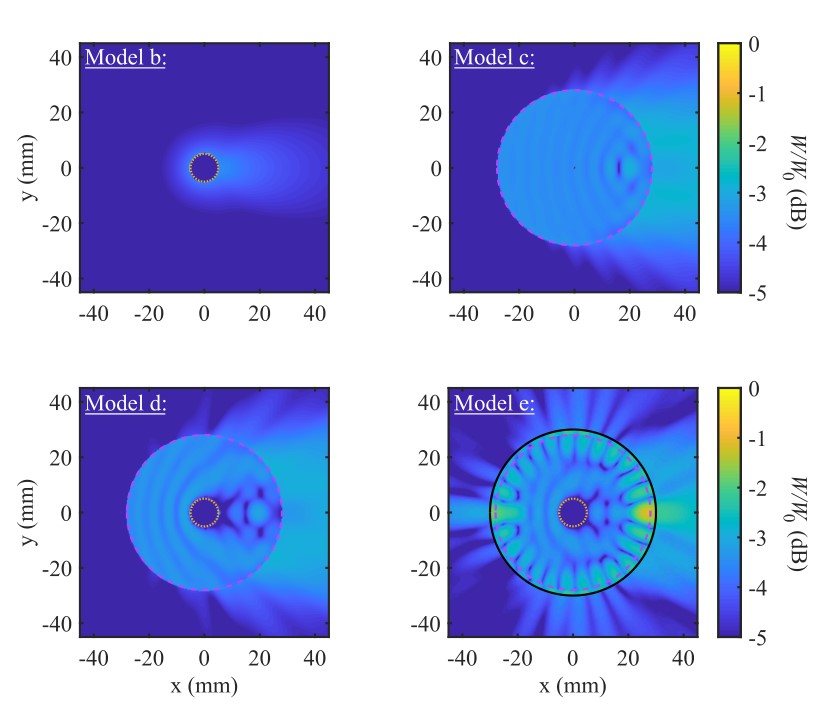
As an additional measure it is also possible to study the temporal evolution of the coherent backscatter cone. The evolution of the cone depends on the transport velocity of acoustic waves in the fish school. Thus, measurements made in the Cannes farms reveal the lowest transport velocity ever observed for acoustic waves: vt∼ 50 m/s (i.e. 30 times lower than the wave velocity in seawater v0= 1500 m/s). Comparison of these measurements with numerical simulations [3] identified the complex structure of fish as responsible for this ultra-slow wave transport. In particular, the association of very soft organs (flesh or swim bladder) with a rigid layer (scales + bones) allows to "trap" the waves in the body of the fish and to slow down considerably the diffusion of the waves (Fig. 4).
Figure 4: Simulation of the acoustic energy scattered by the swim bladder (a) or the fish flesh (b). The inset (c) represents the scattering calculation by a swim bladder surrounded by a layer of flesh. Finally, a hard layer of scales was added for the model calculation (d). This last simulation illustrates the acoustic density "trapped" in the body of the fish resulting in the slowing of the scattering of the waves in the school.
We also quantified the strong dependence of this effect on fish density (Fig. 5), which could also be an avenue for non-invasive biomass estimation.
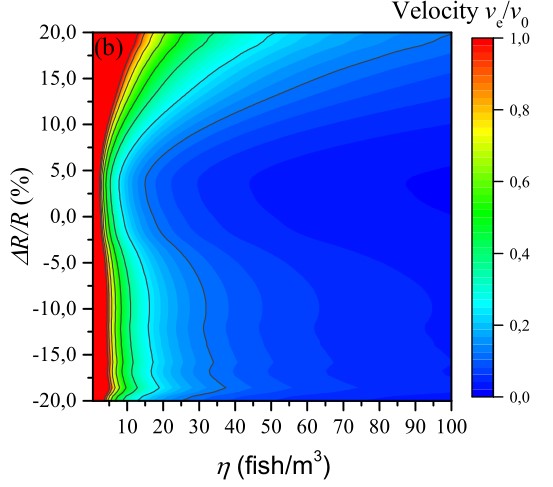
Figure 5: Wave transport velocity calculation as a function of density η and size variation ΔR/R of fish. This result suggests that wave velocity measurement would be a good tool for density estimation once density depends little on fish size variation.
Case N°2: medium density cages - medium fish (Salmon) - classical multiple scattering
The results described in this section concern the study of salmon schools in experiments conducted at the Eide Fjorbruk farm in Norway. The salmon cages are more sparsely concentrated (∼10 fish/m3) than the sea bream cages described previously. This characteristic allows for the identification of a few isolated targets in the first few meters of the acoustic scan before the field becomes multiply scattered.
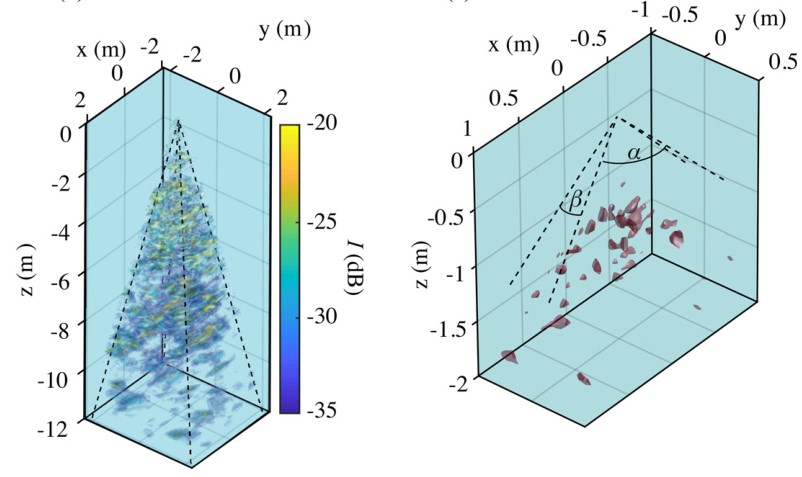
Figure 6: Acoustic scan of the salmon school. While the deep scan (left) reveals a speckle pattern due to multiple wave scattering, the shallow scan (right) allows to isolate and track a few individuals and characterize them.
The detection of these targets allows the measurement of the target strength TS (acoustic reflectivity) of the individuals concerned. Using simple relationships [5] the TS distribution (Fig. 6) allows to estimate the average weight of the salmon present in the cage.
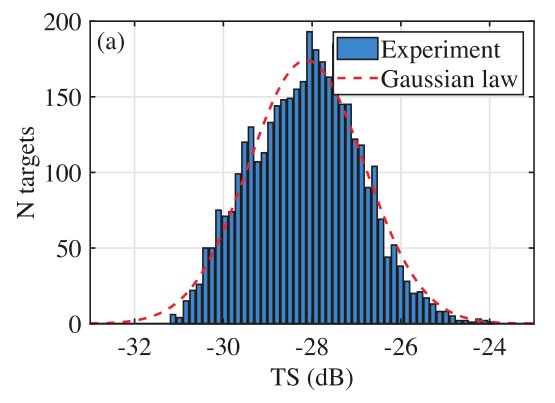
Figure 7: Distribution of target strength TS measured in a salmon cage. According to the literature, an average TS of -28 dB corresponds to a salmon of about 5 kg (in agreement with the fish farmer’s data).
In this type of cage, it is still possible to observe the coherent backscatter effect [6]. However, its appearance is more progressive in time (Fig. 7): the acoustic field is not immediately multiply scattered.
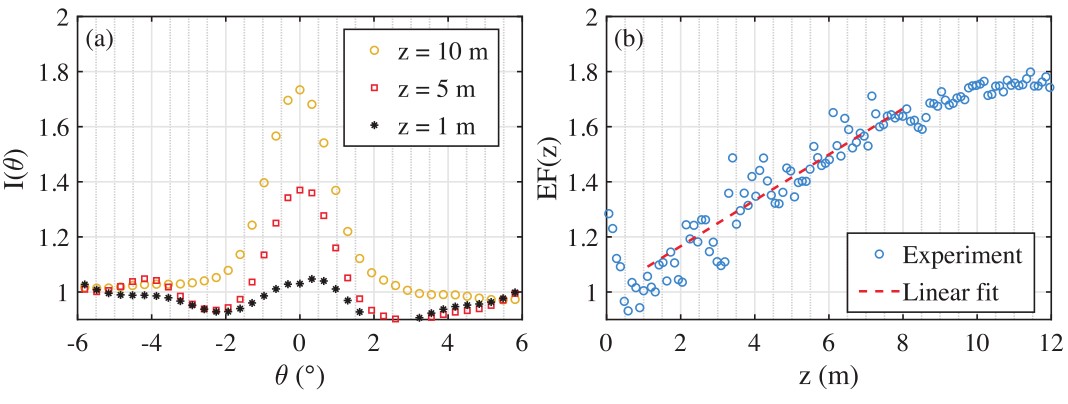
Figure 8: (a) Angular dependence of the acoustic intensity for several scan depths in the cage. The gradual appearance of a coherent backscatter cone illustrates that the acoustic field is only multiply scattered after z∼ 10 m. (b) Amplitude EF(z) of the coherent backscatter cone as a function of the depth of the scan in the cage. The linear fit of this evolution allows to extract the mean free path l_s=(4 ±0.3) m.
The characterization of the evolution of the cone is carried out by the measurement of its amplitude EF(z). Thus the distance z_DM for which EF(z_DM )=2, corresponds to the distance after which the sound field is totally multiply scattered. In contrast, when EF(z_DS )=1 the acoustic field propagates in the simple scattering regime. Previous works [7] have shown that EF(l_s )=4/3 corresponds to the distance called the mean free path (the average distance between two fish). This characteristic distance can be easily related to the fish density η through the TS measurement and the relation :

Applying the method to Norwegian cages, we obtain a density of η=7.4 fish/m3 (in agreement with the aquaculturist’s data: η∼7 fish/m3). The coherent backscatter cone measurement then appears to be a good method for estimating biomass in the multiple scattering regime (while traditional methods fail).
The identification of isolated individuals also allows to estimate their velocity. Thus, the velocity distribution of the school (Fig. 8) can be an additional tool for aquaculture to monitor activity in the cage.
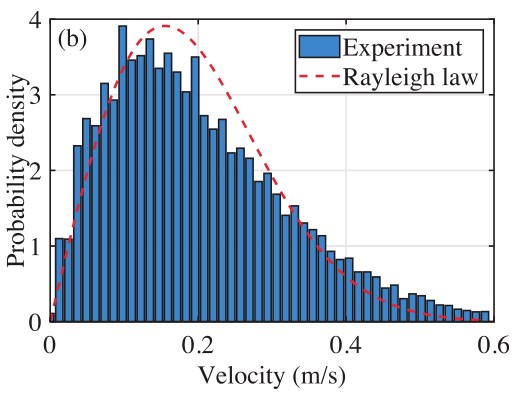
Figure 9: Velocity distribution measured in the salmon bank. Fitting this measurement with a Rayleigh distribution gives the mean velocity v=0.19 m/s. This type of distribution also suggests the random dynamics of the school, as observed during the experiments outside the feeding phases (contrary to the circular swimming adopted by the school when the fish are fed).
The results of these measurements have led to a strong international collaboration between iXblue and ISTerre on the one hand and SINTEF and Aquabio on the other. In particular, Aquabio wishes to exploit the methods developed in this project for the monitoring of aquaculture farms in Norway. In order to test the effectiveness of the method, we have jointly set up a long-term remote controlled measurement experiment. During this experiment, the acoustic probe is positioned in a Norwegian cage for 1 month and monitored from ISTerre. The processing of the data obtained will allow us to estimate the influence of the environment on the measurement (presence of current, periods of high activity, temperature variations...).
Case N°3: low density cage - large fish (Tuna) - single scattering
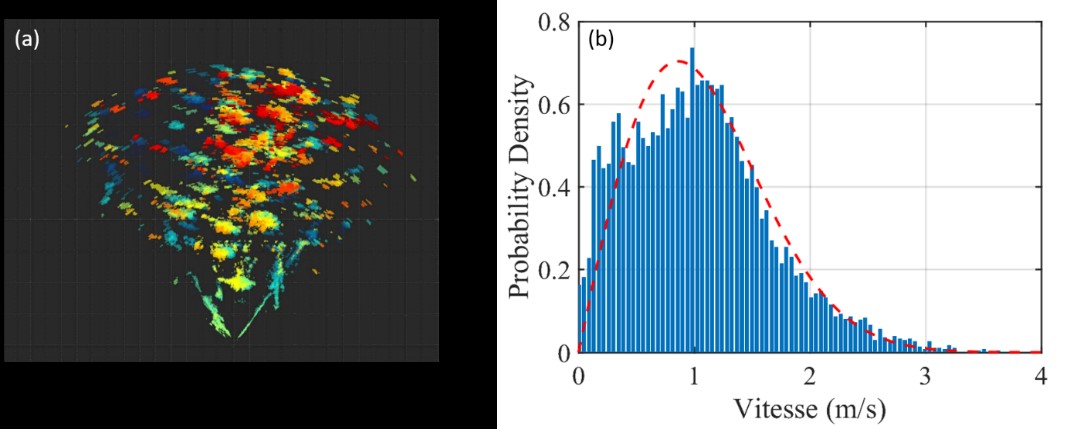
The last part of the study concerns the characterization of schools of tuna during experiments conducted in Spain on June 3 and 4, 2018. These cages contain a low density (η<1 fish/m3) of fast moving tuna. Here, acoustic waves then propagate in a simple scattering regime. Thus the acoustic scan of the cage allows the identification of individuals and the measurement of the velocity distribution of the school (Fig. 10).
Figure 10: (a) Acoustic scan of the cage containing the school of tuna. (b) Velocity distribution measured in the same cage. The fitting of this measurement with a Rayleigh law reveals an average velocity of 1.9 m/s.
The analysis of the tuna swimming reveals that they all swim in the same direction. The application of the echo-integration method on a finite volume [1] associated with the measurement of average speed could allow an estimation of the "passage rate" of tuna (by analogy with fluid mechanics) and lead to the total biomass in the cage.
In order to confirm these results and test the reproducibility of the method, another campaign of experiments was carried out at the Balfego Farm in Ametlla de Mar from March 29 to April 2, 2021. Having had access to more rearing cages, this new measurement campaign allowed refining the empirical law established in the experiments performed in 2019 (Fig. 11).
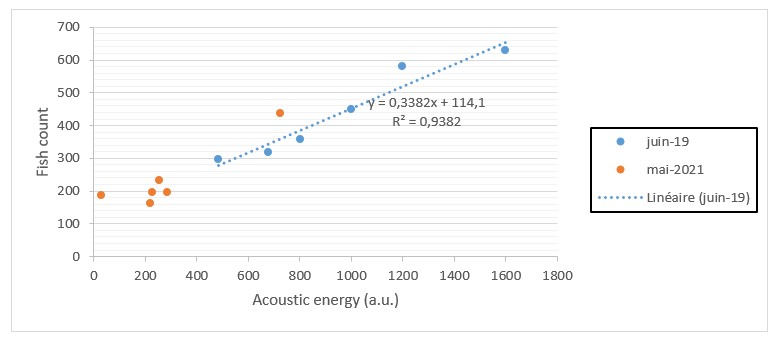
Figure 11: Acoustic energy measured as a function of the number of individuals in the cage (for the two measurement campaigns conducted in 2019 and 2021). The linear fit of the 2019 measurements represents the empirical law used to estimate the number of tuna in the cage.
References
[1] J. Simmonds et D. N. MacLennan, Fisheries Acoustics: Theory and Practice, Wiley, 2008.
[2] D. Li, Y. Hao et Y. Duan, «Nonintrusive methods for biomass estimation in aquaculture with emphasis on fish: a review,» Reviews in Aquaculture, 2019.
[3] B. Tallon, P. Roux, G. Matte, J. Guillard et S. E. Skipetrov, «Mesoscopic wave physics in fish shoals,» AIP Advances, vol. 10, p. 055208, 2020.
[4] M. P. van Albada et A. Lagendijk, «Observation of Weak Localization of Light in a Random Medium,» Phys. Rev. Lett., vol. 55, pp. 2692-2695, 1985.
[5] J. Lilja, T. J. Marjomäki, J. Jurvelius, T. Rossi et E. Heikkola, «Simulation and experimental measurement of side-aspect target strength of Atlantic salmon (Salmo salar) at high frequency,» Can. J. Fish. Aquat. Sci., vol. 61, p. 2227, 2004.
[6] B. Tallon, P. Roux, G. Matte, J. Guillard et S. E. Skipetrov, «Acoustic density estimation of dense fish shoals,» The Journal of the Acoustical Society of America, vol. 148, pp. EL234-EL239, 2020.
[7] A. Derode, V. Mamou, F. Padilla, F. Jenson et P. Laugier, «Dynamic coherent backscattering in a heterogeneous absorbing medium: Application to human trabecular bone characterization,» Appl. Phys. Lett., vol. 87, p. 114101, 2005.
Updated on 13 September 2022


